Curious look into the quality of evidence produced in clinical trials
Veronika Valdova • December 14, 2019
Interventional studies: quality of evidence
As of today, there are 256,092 interventional studies
in the ClinicalTrials.gov registry. This NIH-operated database is not the only one but the most relevant and complete source of information on ongoing and completed clinical trials. The available information includes basic study descriptors such as phase, type, interventions, funding, and sponsors and co-sponsors; number of enrolled subjects and their demographic characteristics such as gender and age, and more detailed descriptors of study design such as masking, intervention model and allocation; as well as primary purpose and endpoint classification. This article is the first piece from a series of analyses of interventional trials on this database.
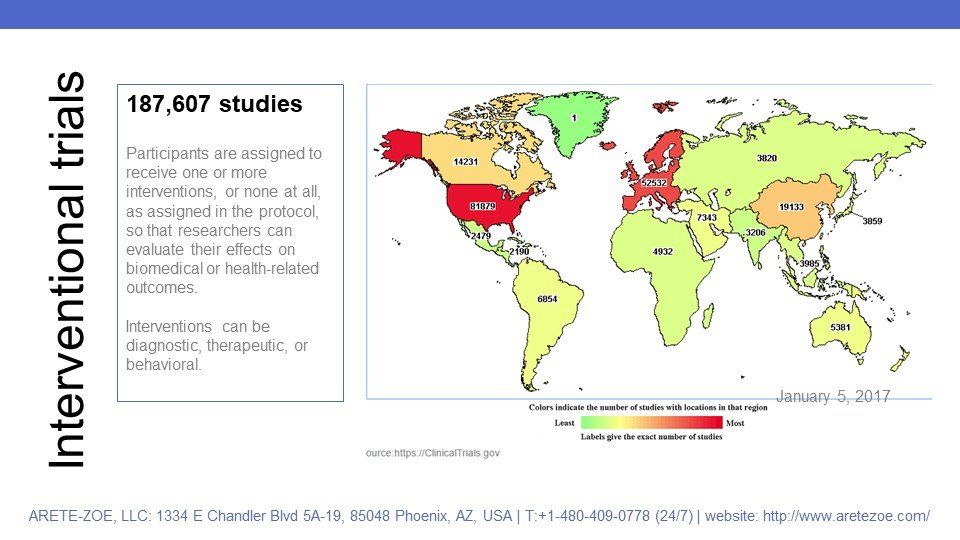
In interventional trials, the participants are assigned to receive one or more interventions or none at all, as assigned in the protocol. The objective is to gather and evaluate data from comparable groups of participants who only differ in the intervention they receive so that researchers can assess the effects of these interventions on biomedical or health-related outcomes. In general, interventions can be diagnostic, therapeutic, or behavioral.
Level of Evidence
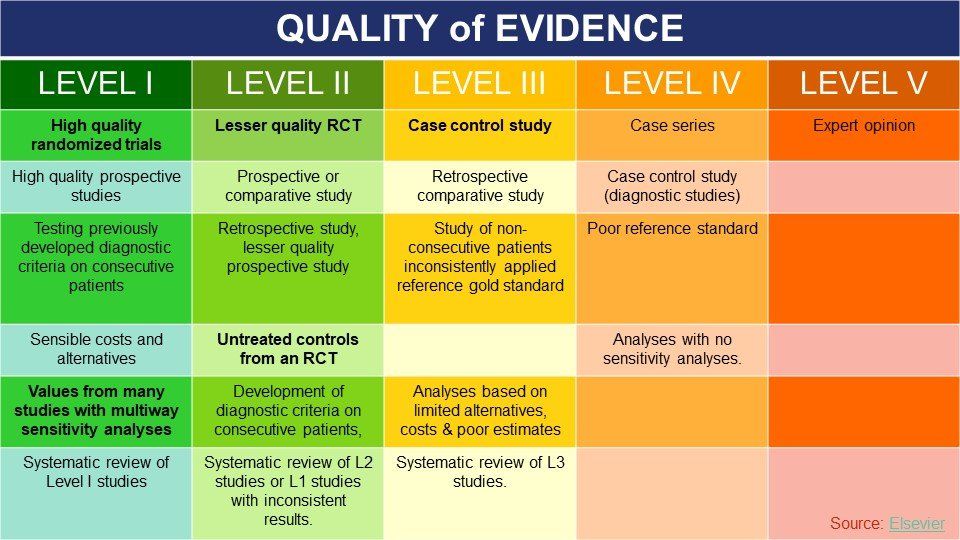
For a biomedical researcher, the level of evidence produced in clinical trials is essential to determine the overall impact of the study on benefit-risk assessments of the studied interventions, treatment guidelines, recommendations for reimbursement, and other assessments. Most organizations have a structured and comprehensive way of assessing scientific evidence that is coming in. However, there are no universal standards or generally accepted guidelines for doing so, and these evaluations differ from one organization or journal to another.
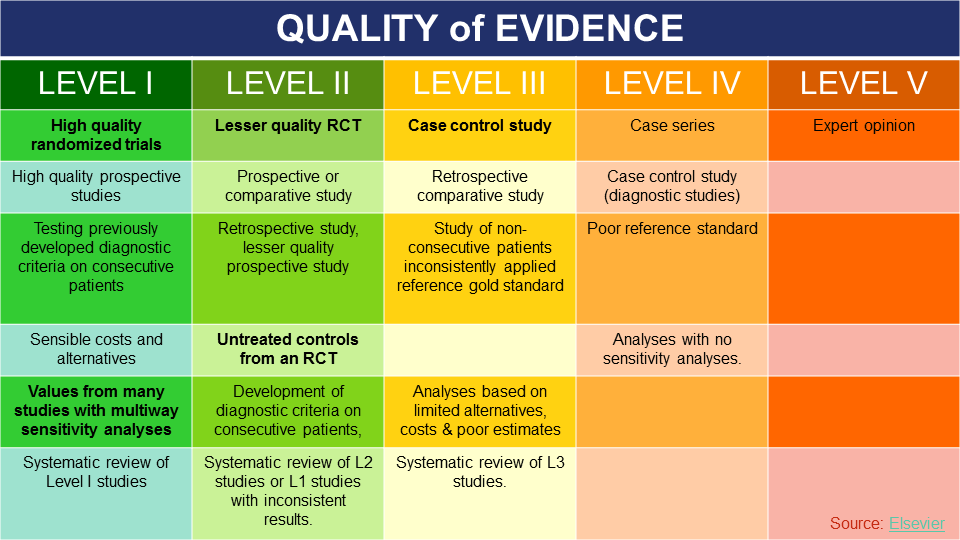
Level I evidence includes:
- High-quality randomized trial or prospective study;
- Testing of previously developed diagnostic criteria on consecutive patients;
- Sensible costs and alternatives;
- Values obtained from many studies with multiway sensitivity analyses;
- A systematic review of Level I RCTs and Level I studies.
Some past scandals illustrate the extent of the problem very clearly: scientific opinions on the value, power, and level of evidence produced by the RECORD study meant the difference between acceptance and rejection of GSK’s drug Avandia. Assessment of quality of evidence produced in a study has real-life consequences, both medically and financially.
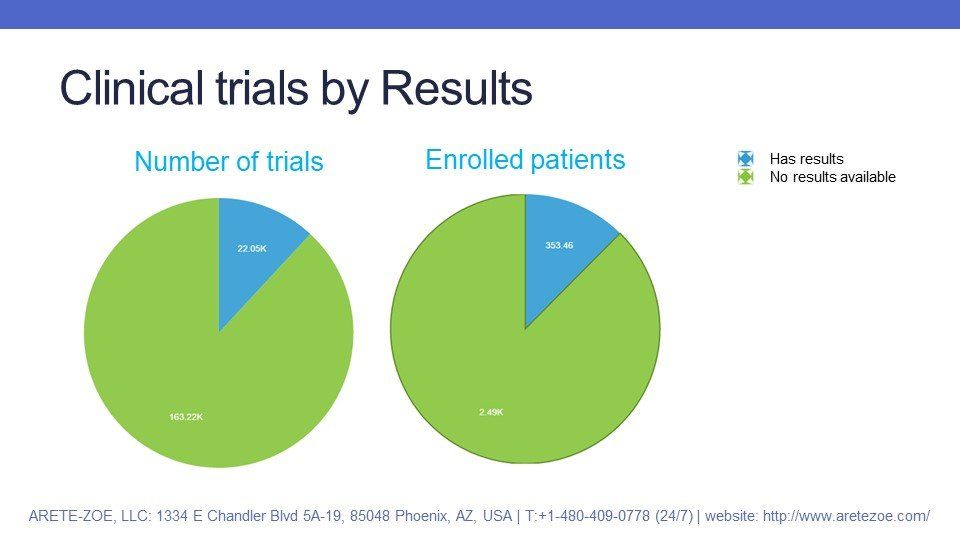
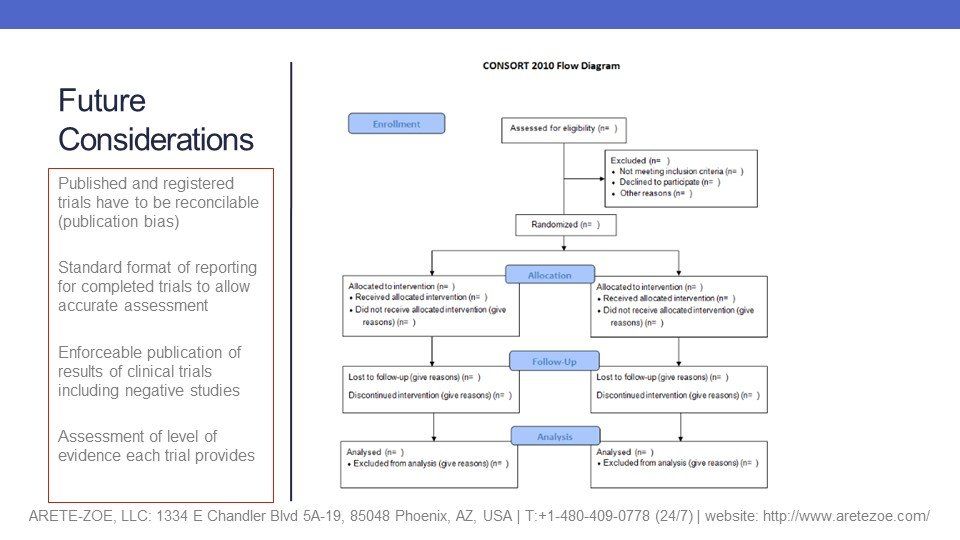
Unfortunately, ClinicalTrials.gov does not provide an assessment of evidence produced by studies included in the registry. The NIH leaves it solely to the assessor to decide how valuable each trial is in the context of all other available information.
Data
- Processing the dataset before analysis included deletion of extra columns, standardization of null values, and removal of trials scheduled to start after 2016. The material, therefore, does not serve as a prediction but solely as a review of studies that already started.
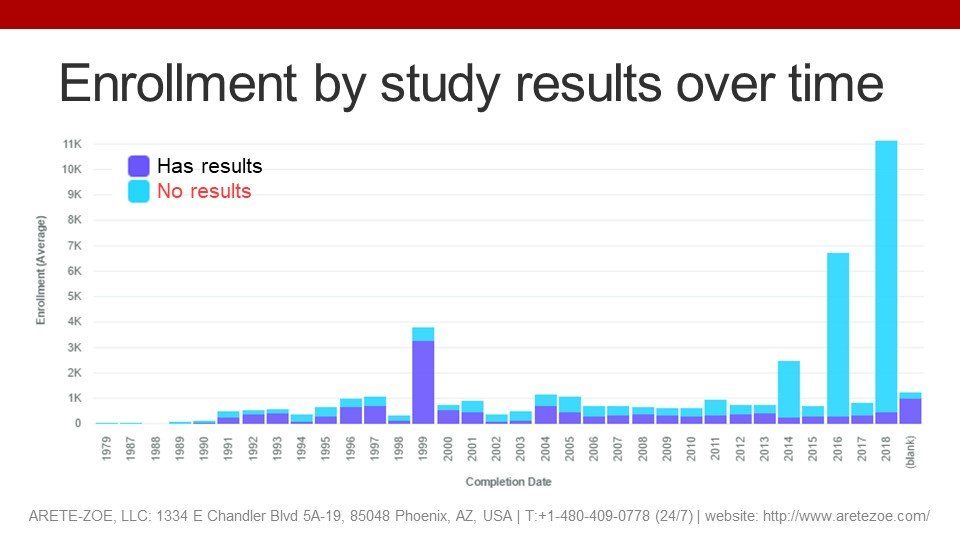
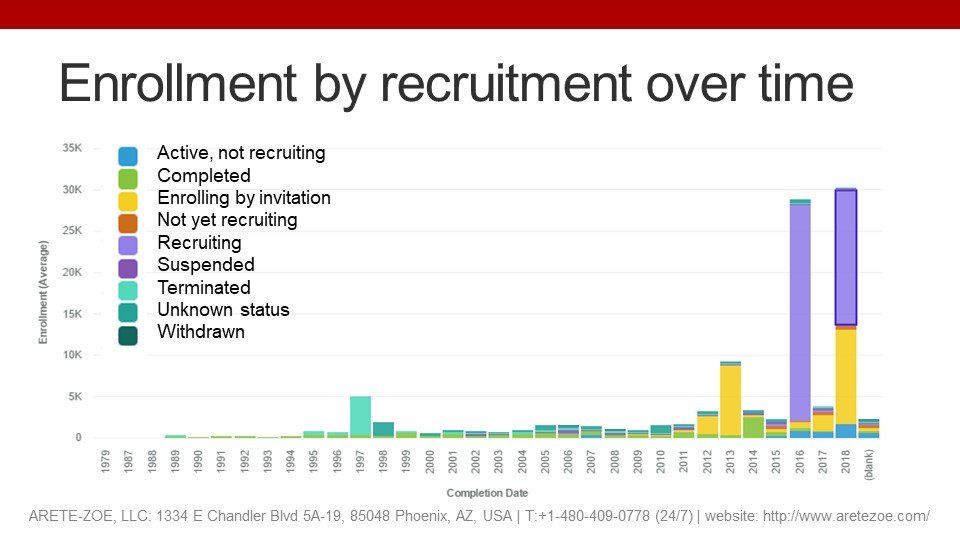
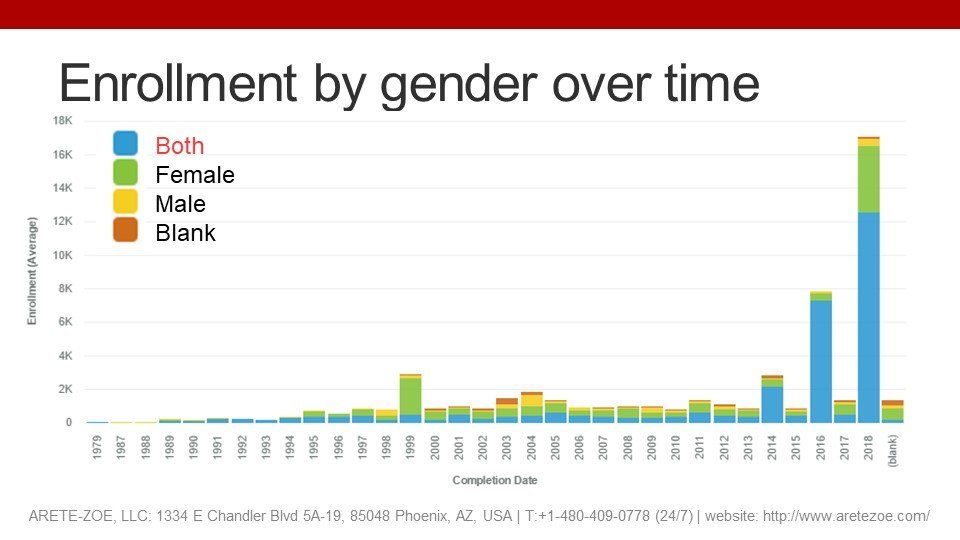
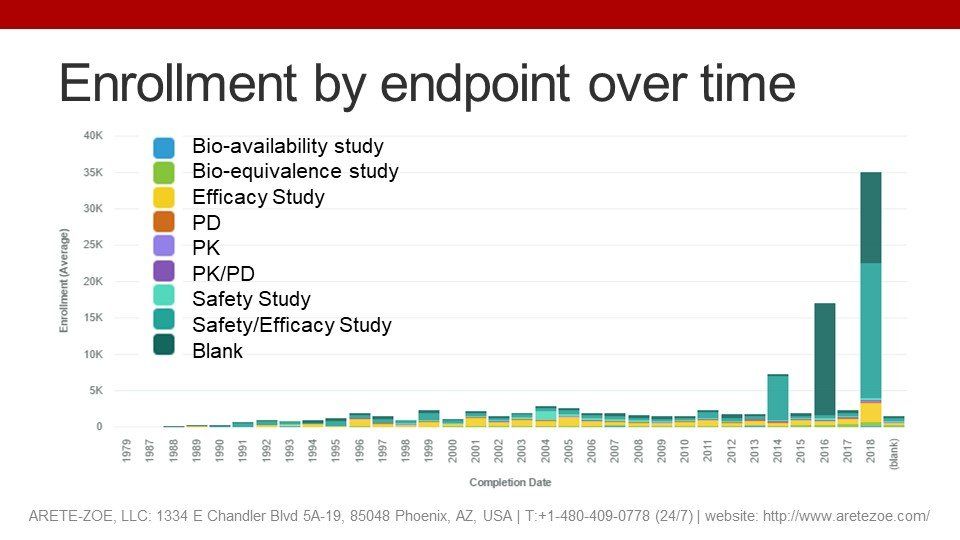
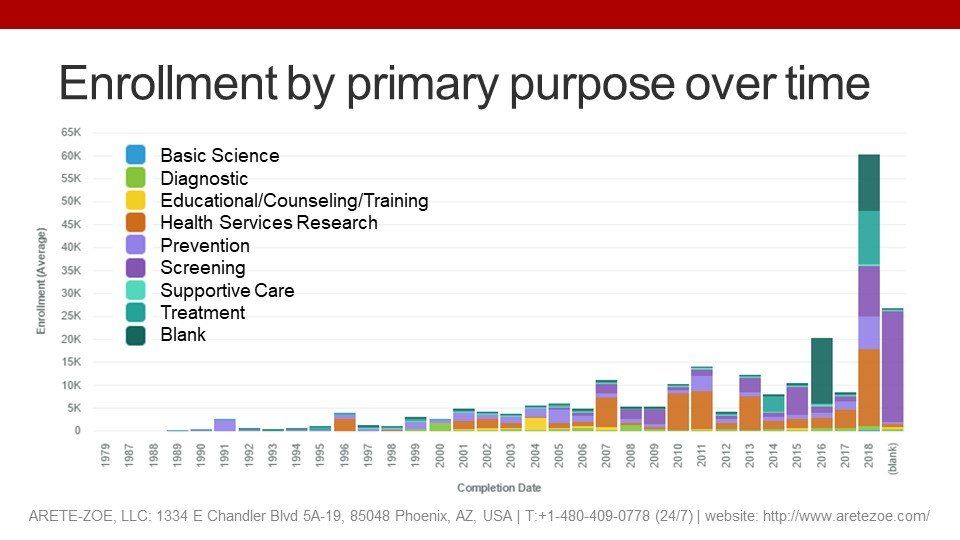
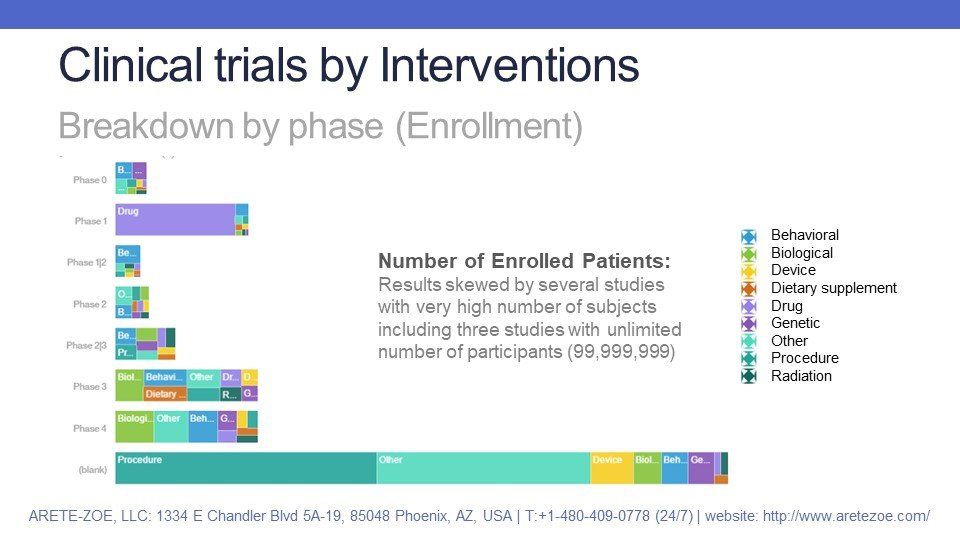
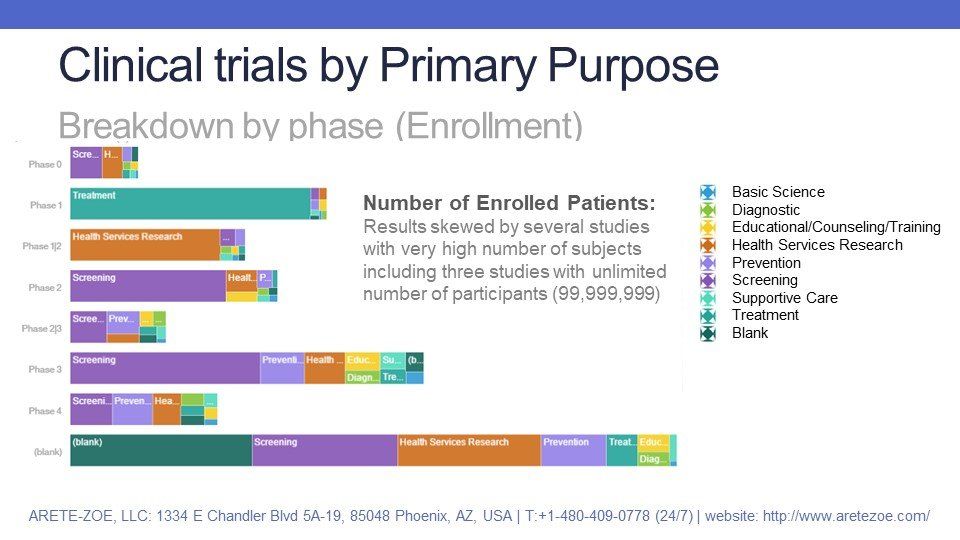
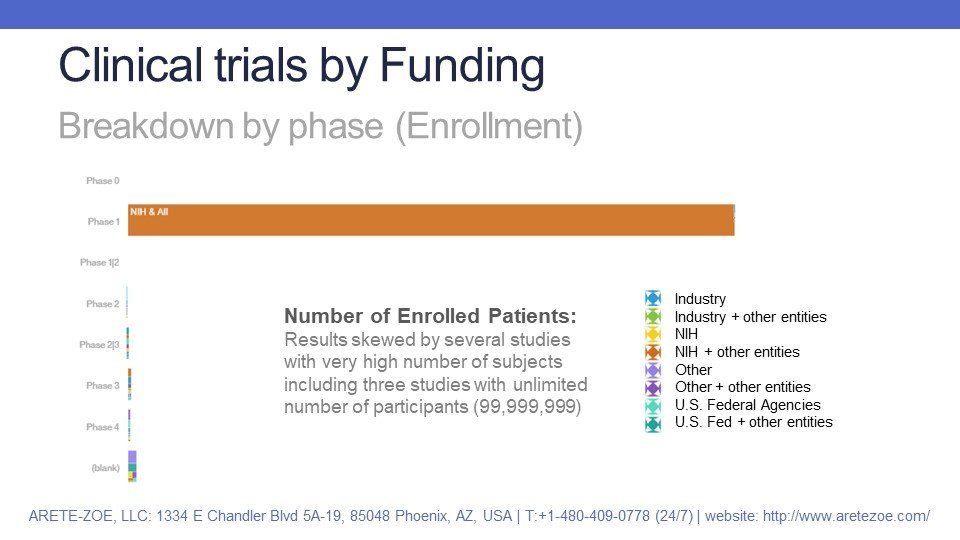
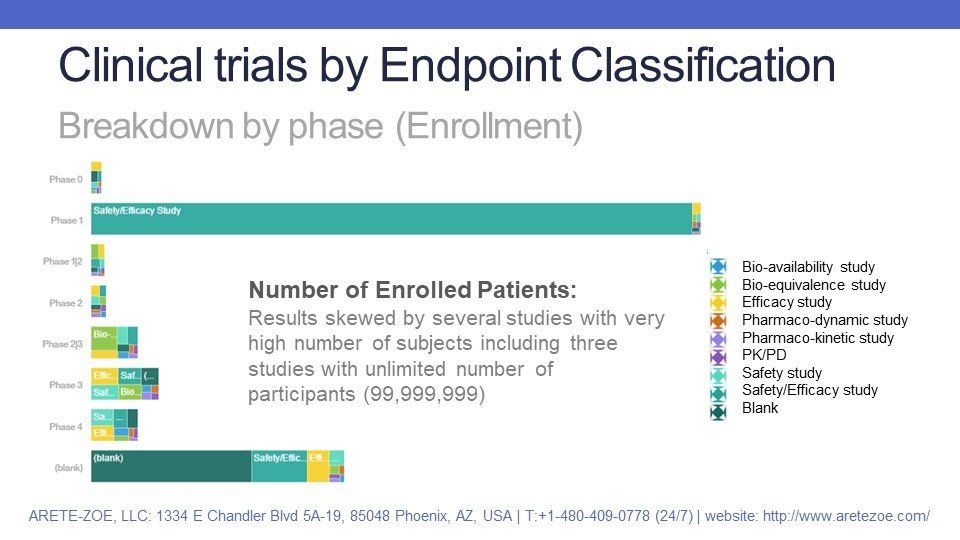
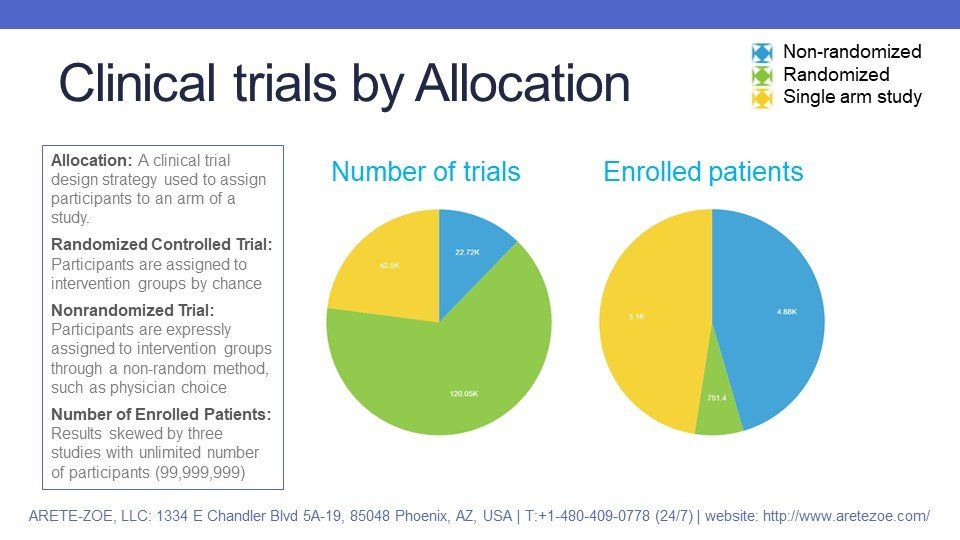
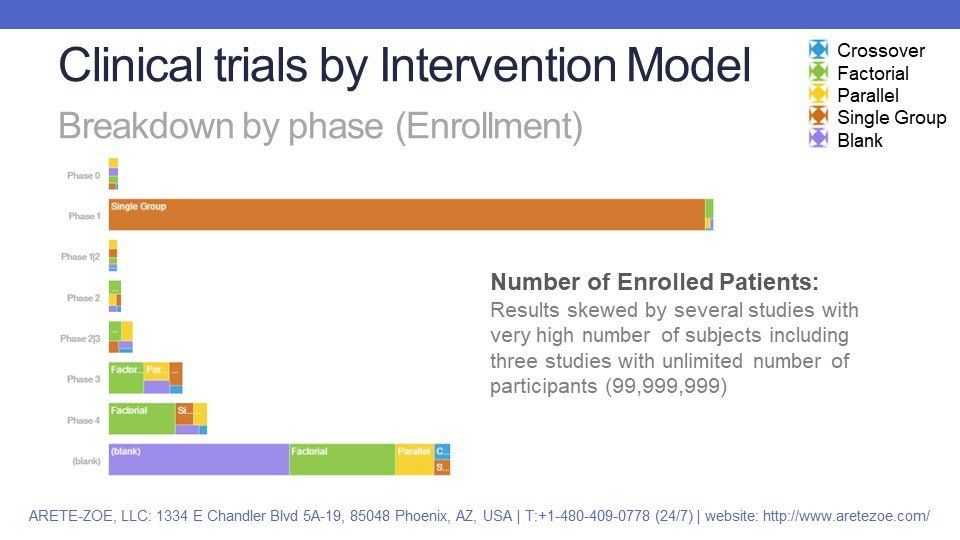
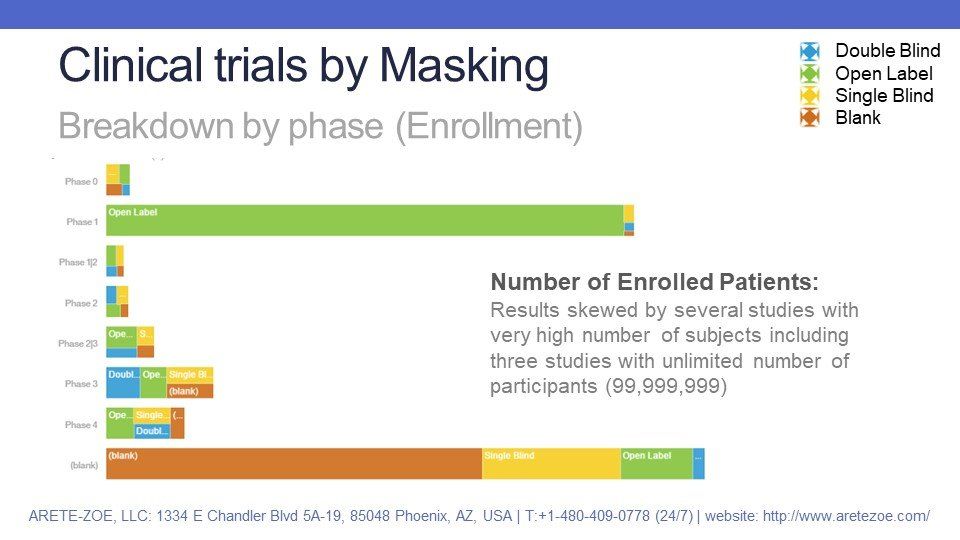
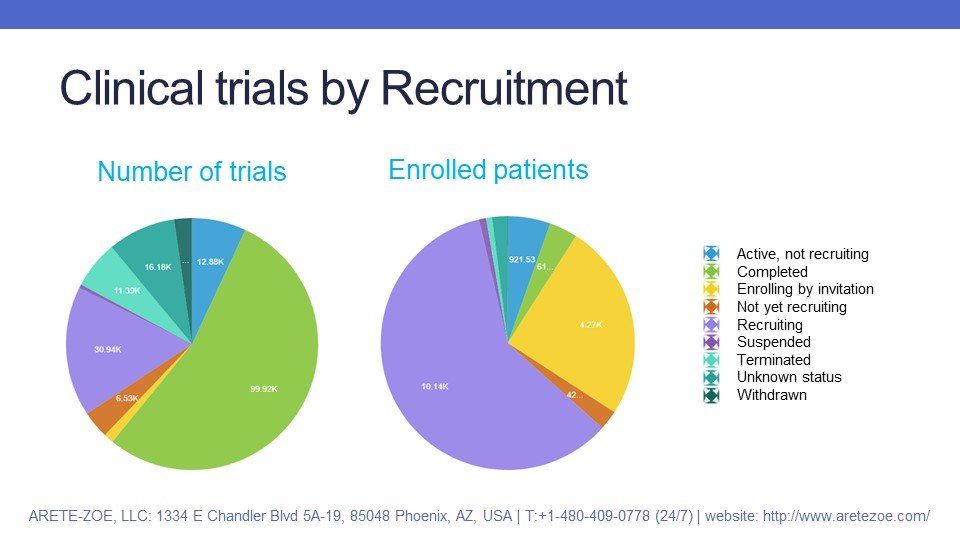
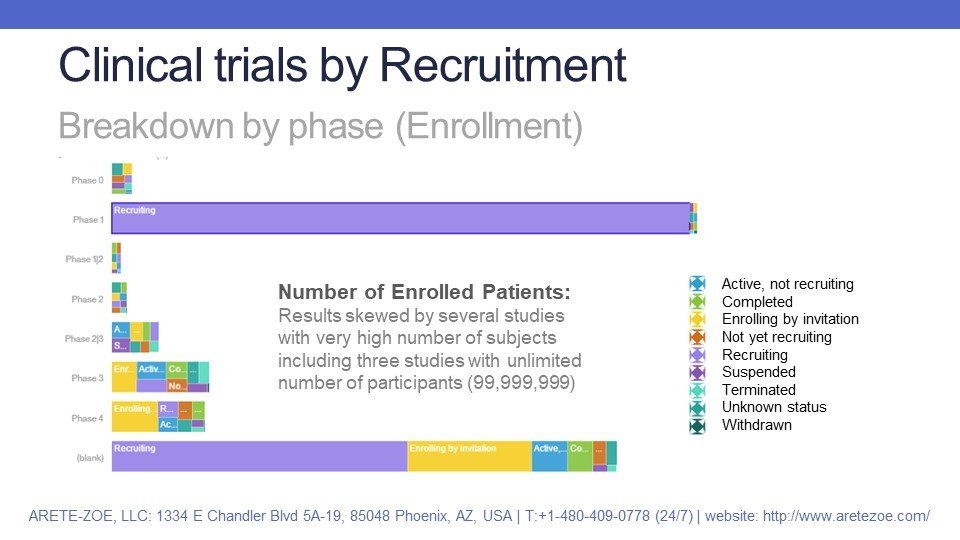
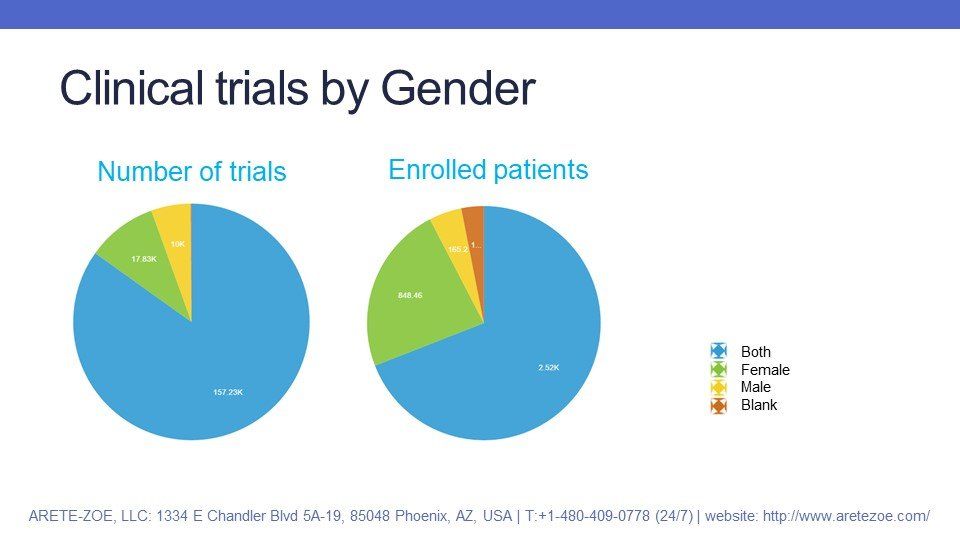
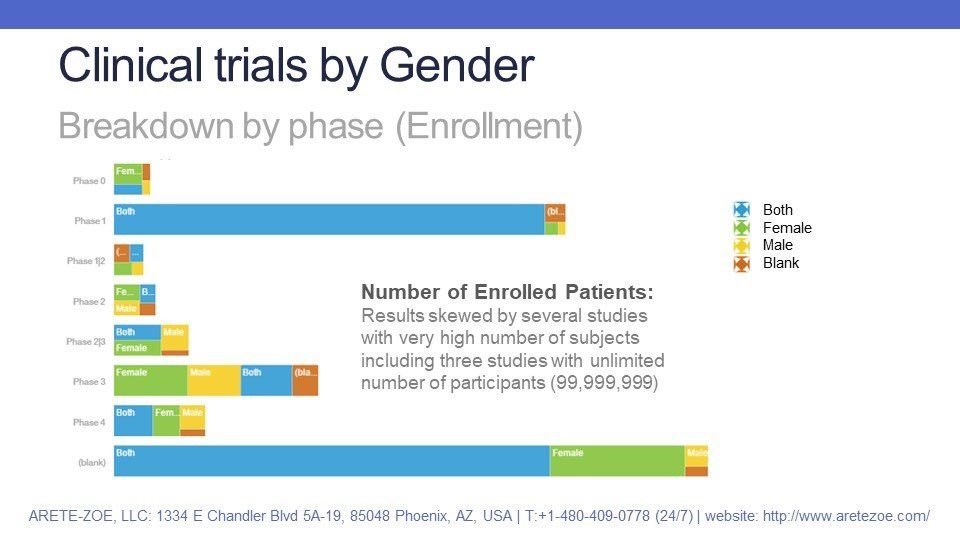
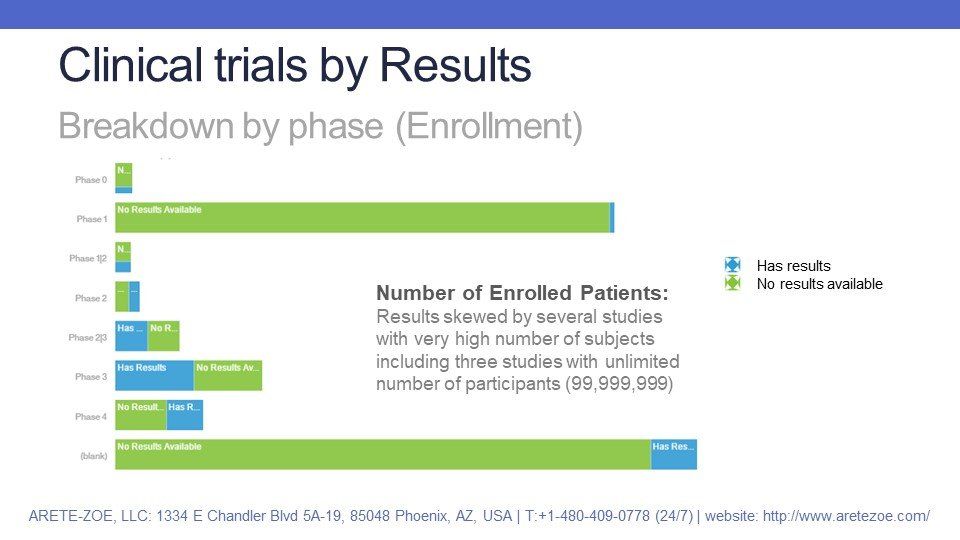
- Enrollment figures are skewed by a small number of studies with a very high number of participants (millions of subjects). Three studies listed the total number of participants at 99,999,999. These outlier figures skew the trends. Moreover, the number of planned and enrolled subjects can differ significantly, so the reliability of this data depends on the stage of the trial (plan, estimate, in progress, or completed and updated).
Type of Interventions
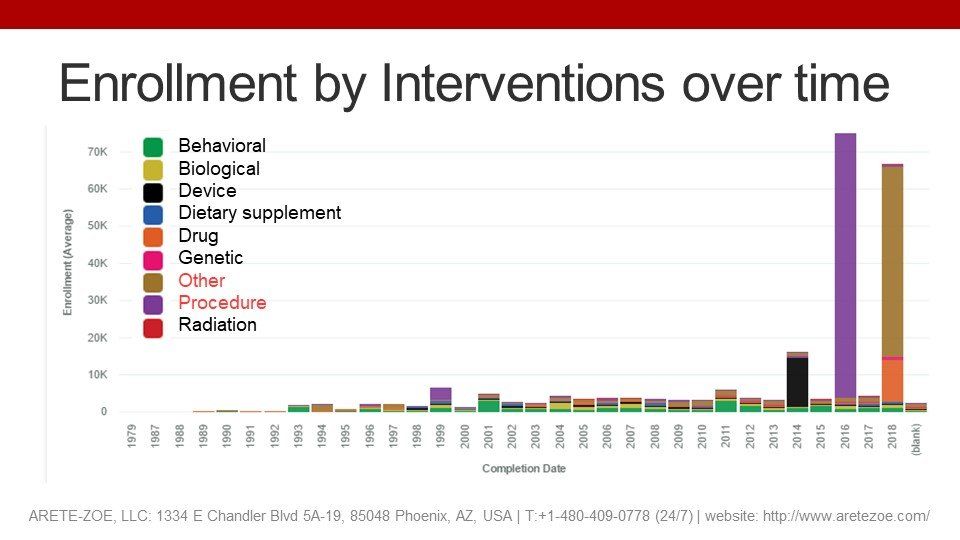
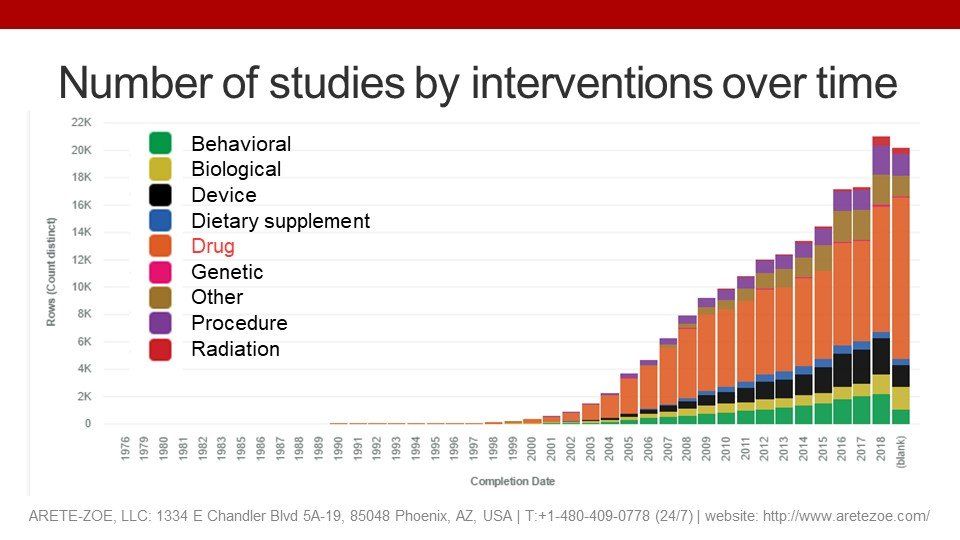
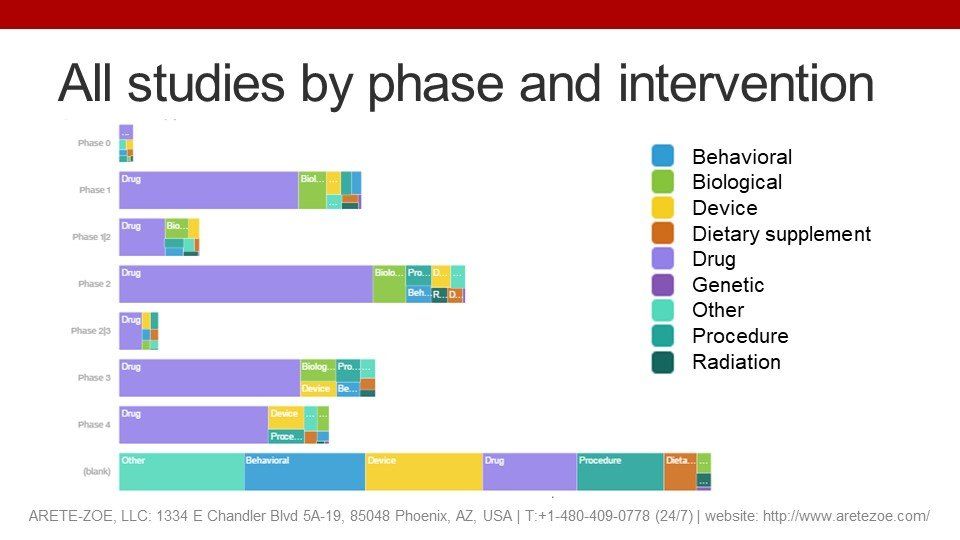
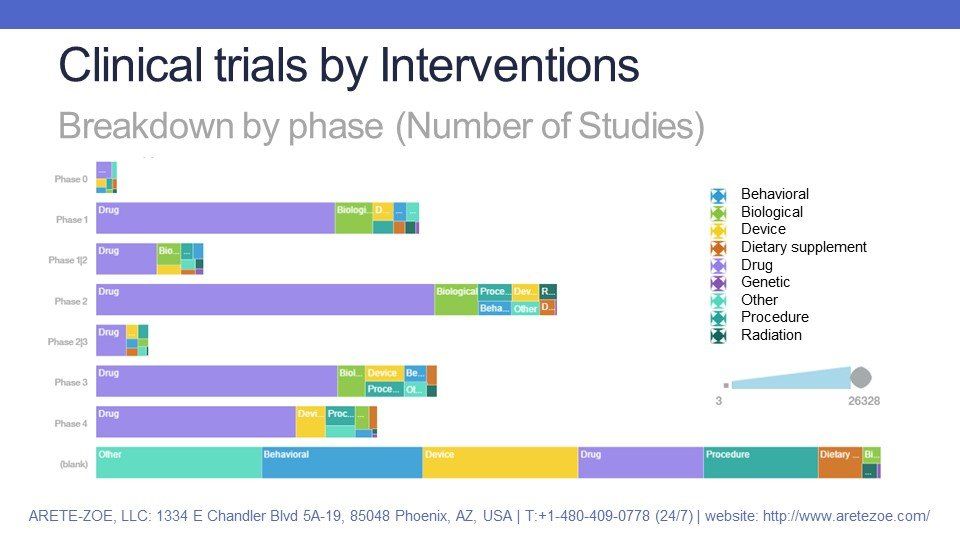
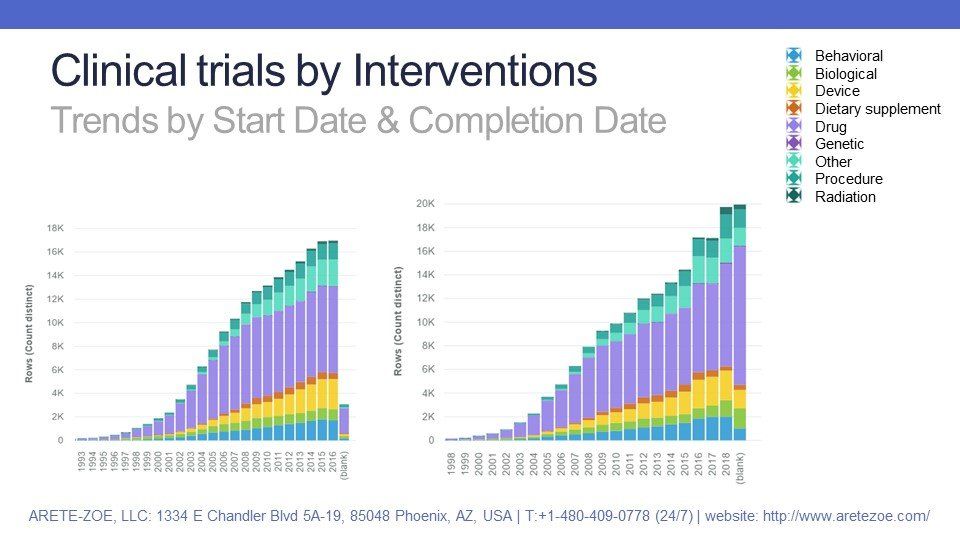
About half of all clinical trials studied drugs as the intervention in question. Biologics, devices, procedures, and other types of interventions account for most of the remaining 50%. A relatively small number of interventions concerned radiation therapy and dietary supplements. Breakdown by phase shows similar distribution by each phase: the majority of interventions for trials in phase I to IV are drugs, followed by biologics, devices and procedures. A relatively high number of trials does not have any phase stated; for these, the interventions fall almost evenly fall into categories “other”, “behavioral”, “device”, “drug” and “procedure”.
Phases
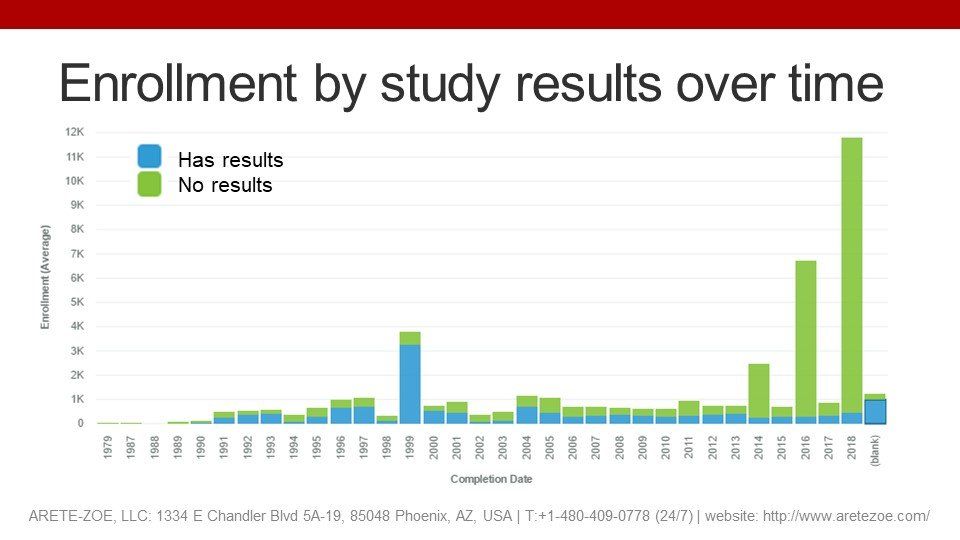
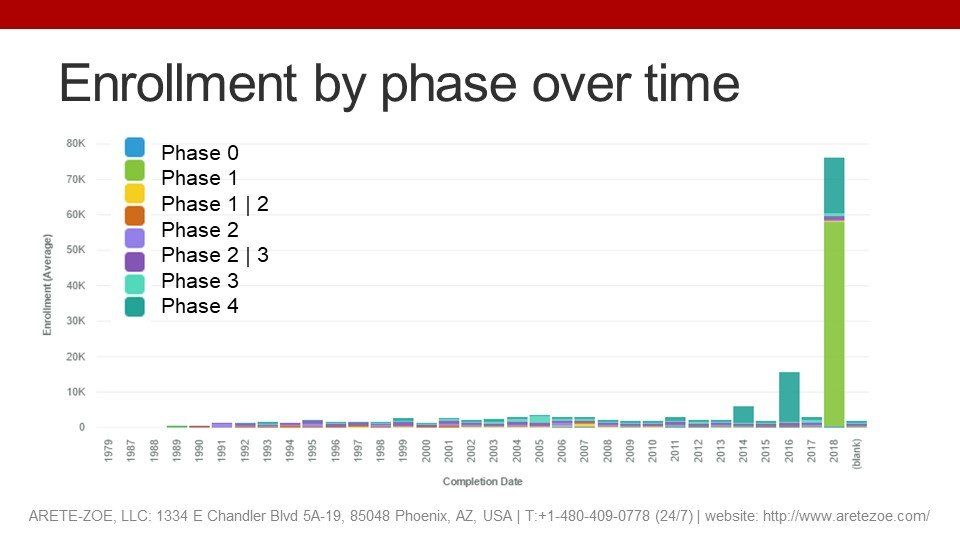
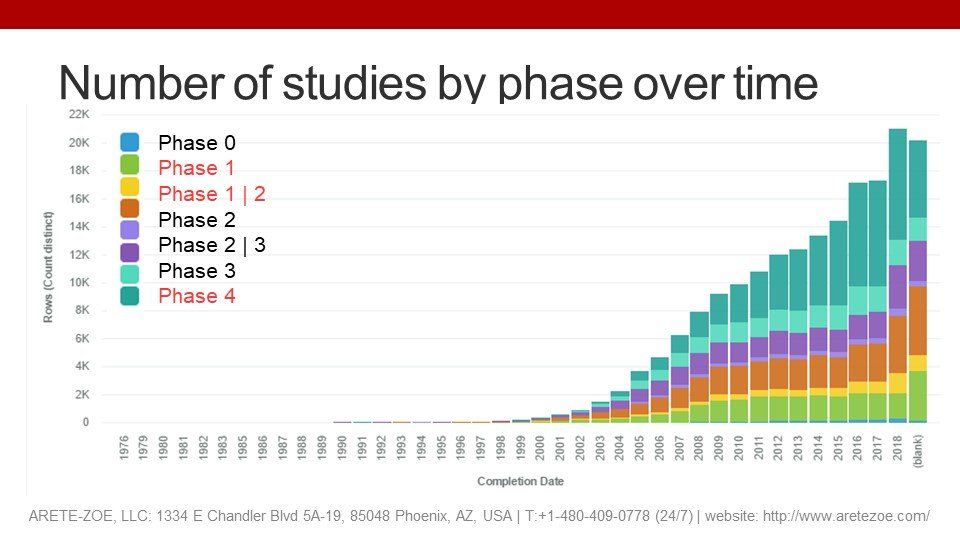
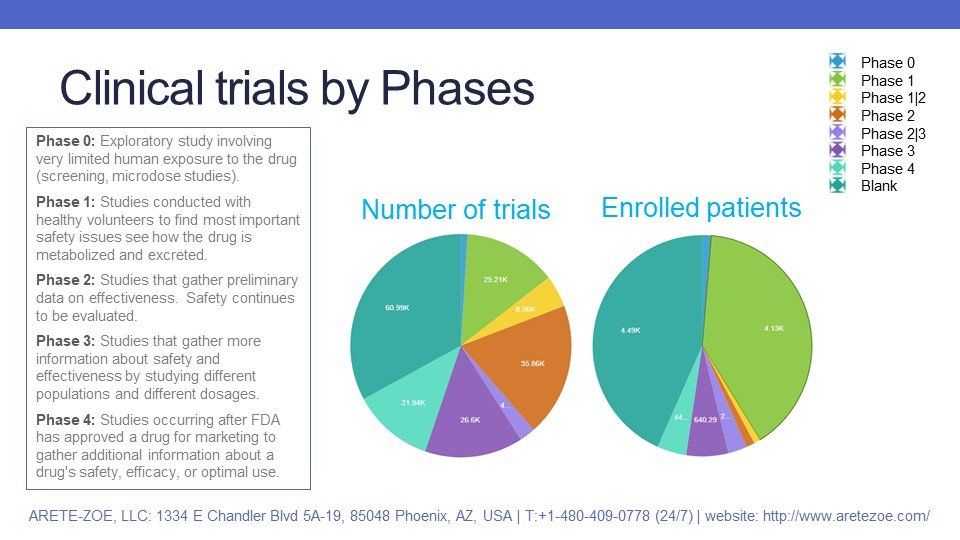
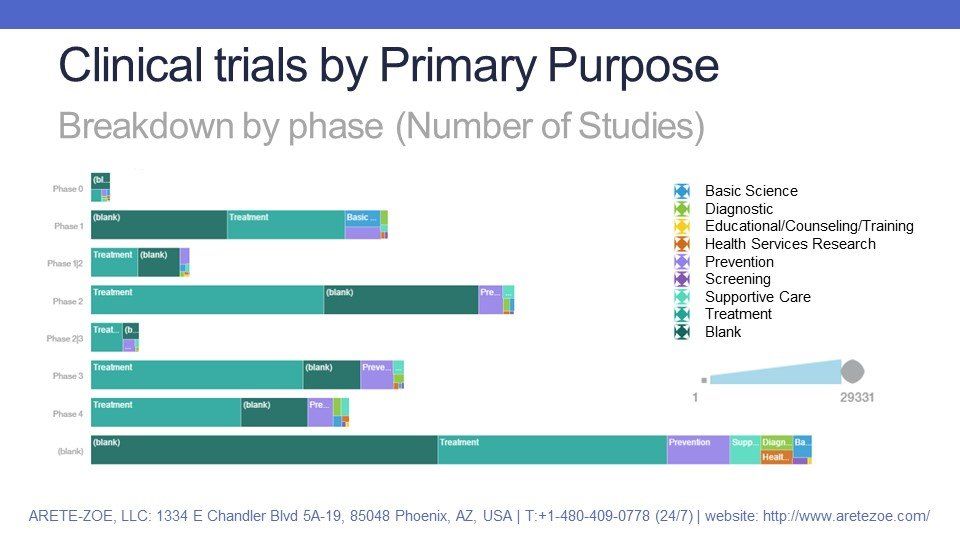
As mentioned previously, about one-third of clinical trials have no phase stated. Early-stage trials (phase I and II) create one third, and the remaining third goes to phase III and IV studies. One would expect that the highest number of enrolled subjects would be in late-stage and post-marketing studies, but that’s not the case: the few previously mentioned studies with a very high declared number of subjects are Phase I and undeclared.
Primary purpose
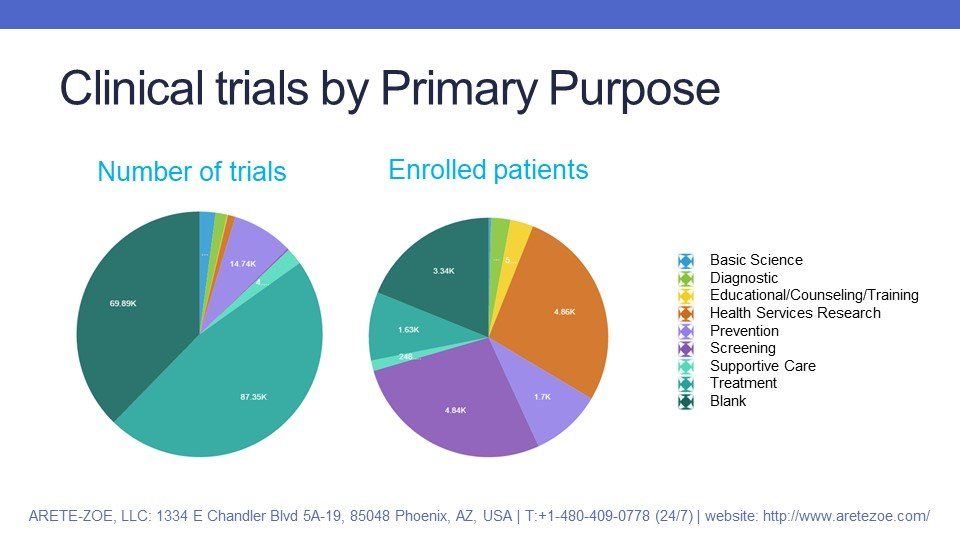
Nearly half of the studies are conducted for treatment purposes. About 40% of all studies have no primary purpose stated.
Funding
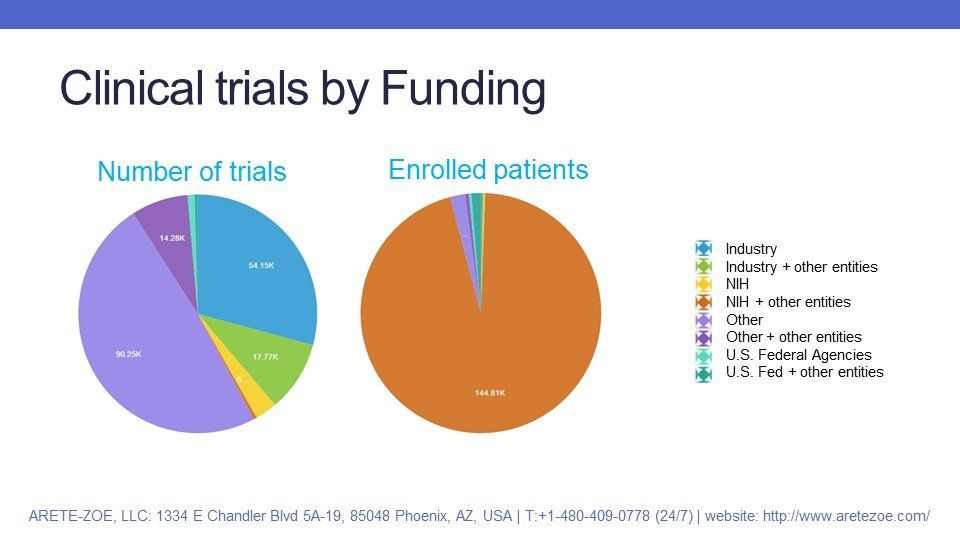
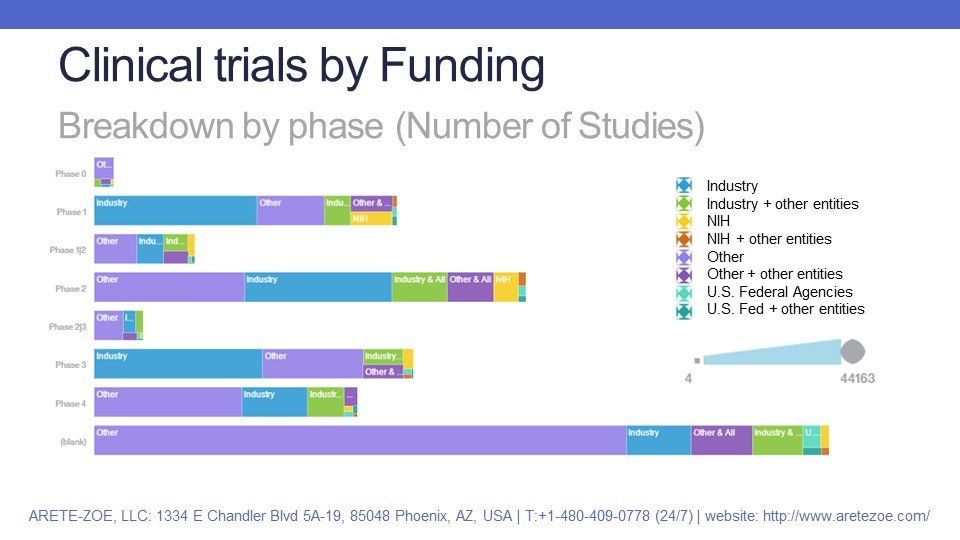
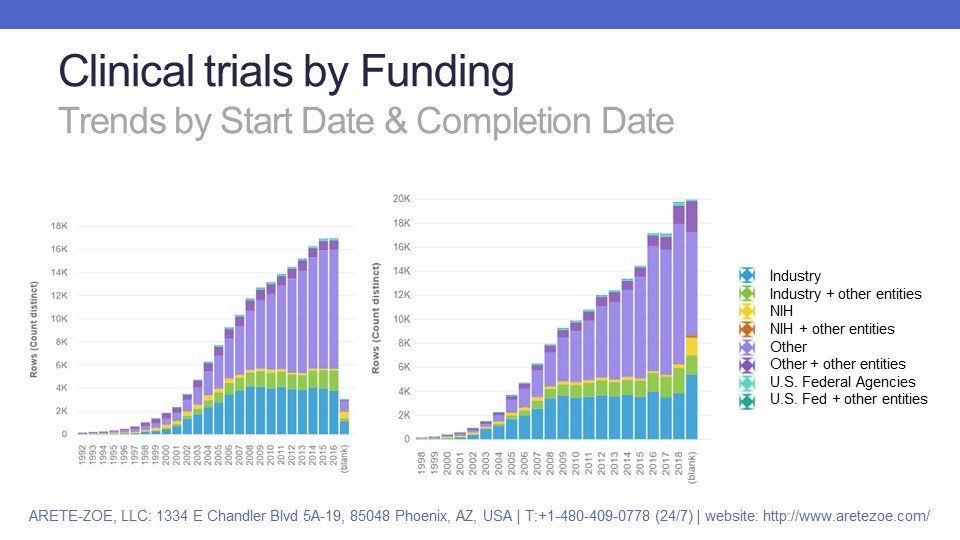
The highest share of studies, about a half, is funded by entities categorized as “other”, even more, if we include “other” in cooperation with other entities. The category "other" is a very broad category that includes academic institutions, individuals, and community-based organizations, including hospitals. About one-third of all trials are funded by industry.
Endpoint classification
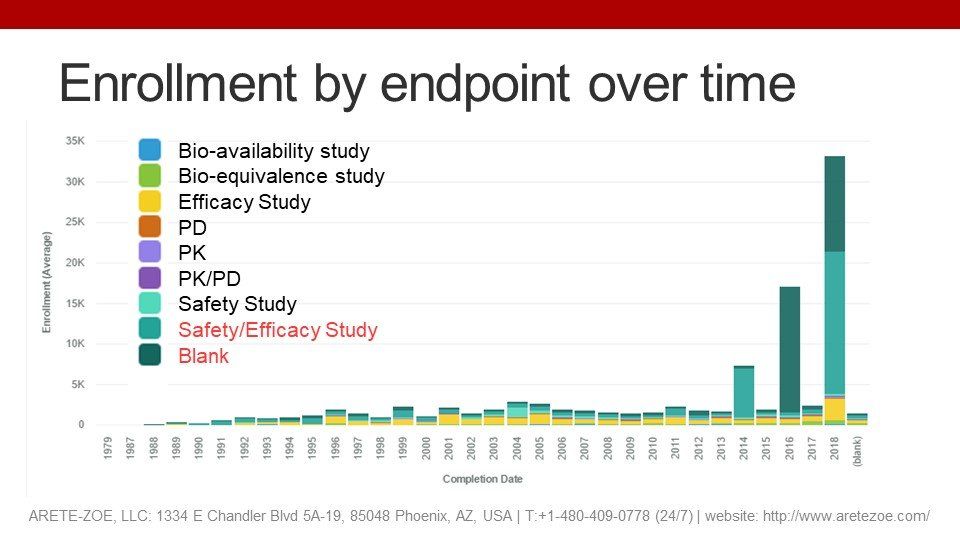
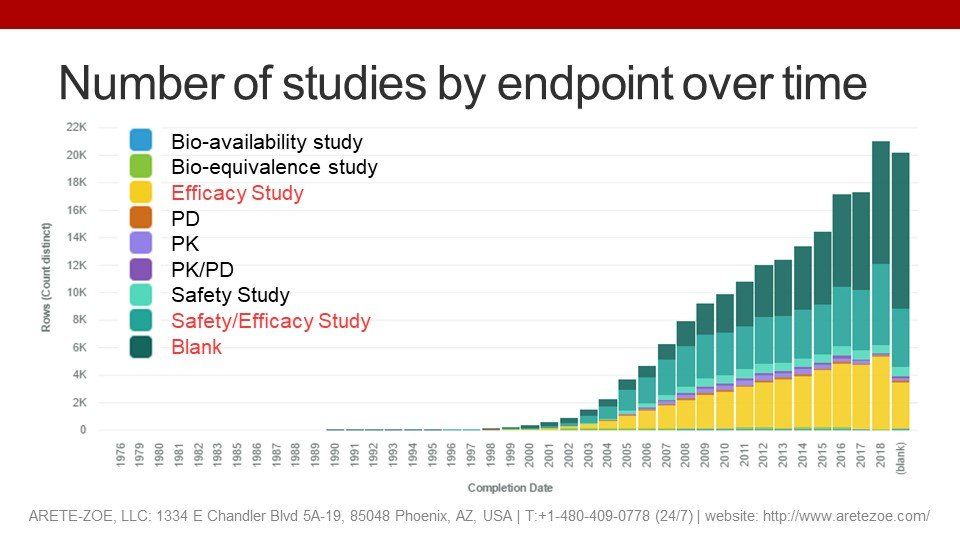
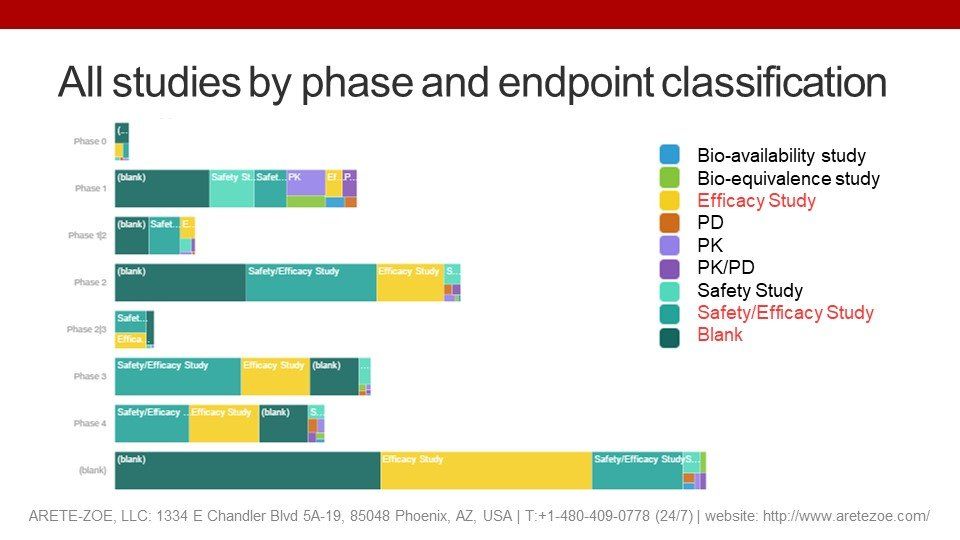
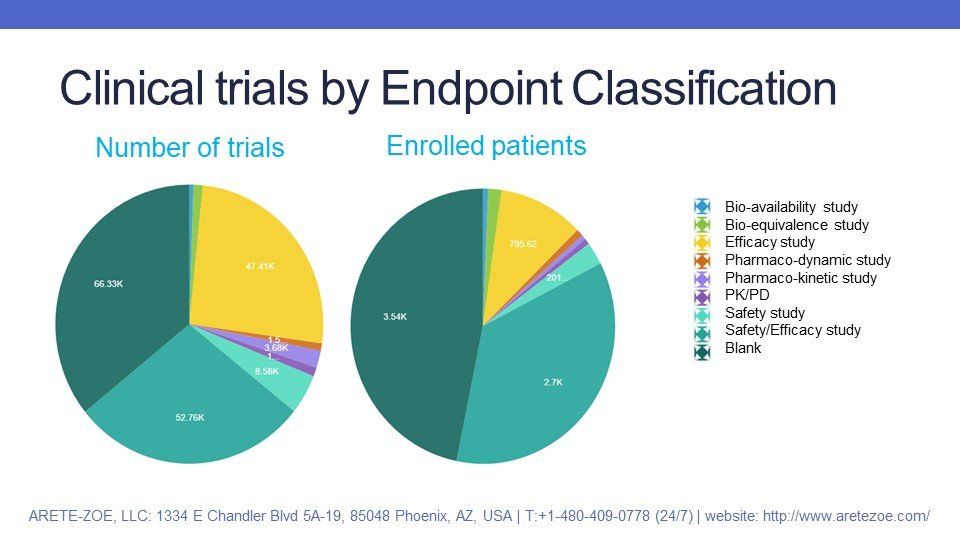
The majority of all studies are conducted to satisfy safety and efficacy-related questions. More than a third of studies have no endpoint stated.
Quality attributes
The main quality attributes readily available for scrutiny are characteristics of study design: masking, allocation, and intervention model.
Allocation
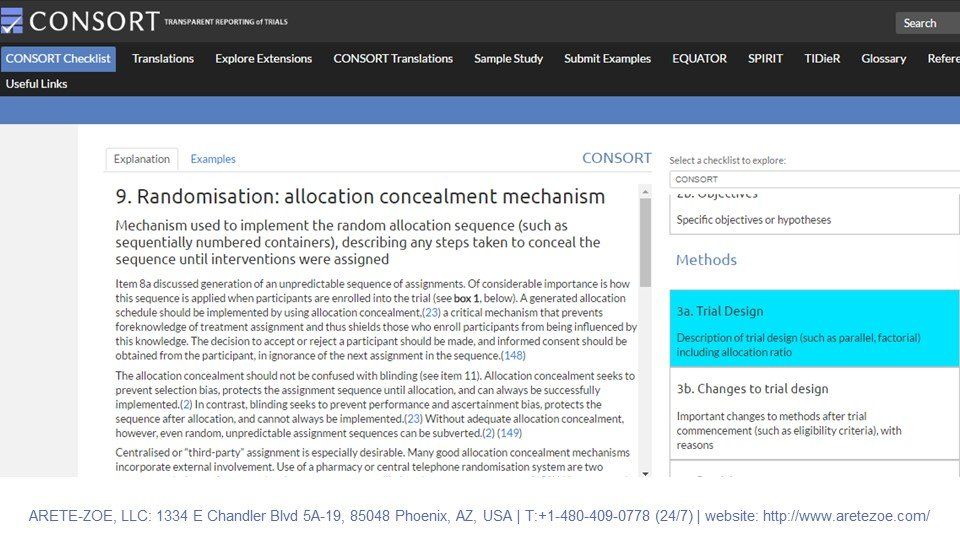
is a clinical trial design strategy used to assign participants to an arm of a study. In a Randomized Controlled Trial, the participants are assigned to intervention groups by chance. If the trial is non-randomized, the participants are expressly assigned to intervention groups through a non-random method, such as physician choice. Allocation is not relevant for single-arm studies where all participants receive the same treatment. The gold standard scientific evidence is produced through randomized controlled trials.
Masking
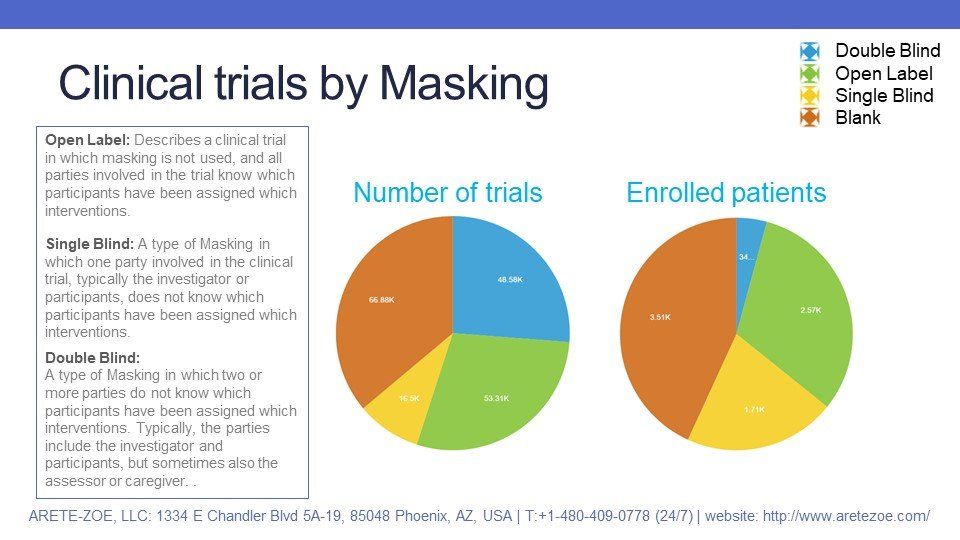
is a design strategy in which one or more parties involved in the trial, usually the investigator or participants, do not know which participants have been assigned which interventions. The primary purpose of masking is to prevent placebo effect, post-randomization confounding bias, selection bias, or group differences n loss to follow-up and information bias - that is bias due to differences in reporting of symptoms.
- "Open-label" study describes a clinical trial in which masking is not used, and all parties involved in the trial know which participants have been assigned which interventions.
- In single-blinded studies, one party involved in the clinical trial, typically the investigator or participants, does not know which participants have been assigned which interventions.
- In double-blinded studies, two or more parties do not know which participants have been assigned which interventions. Typically, the parties include the investigator and participants, but sometimes also the assessor or caregiver.
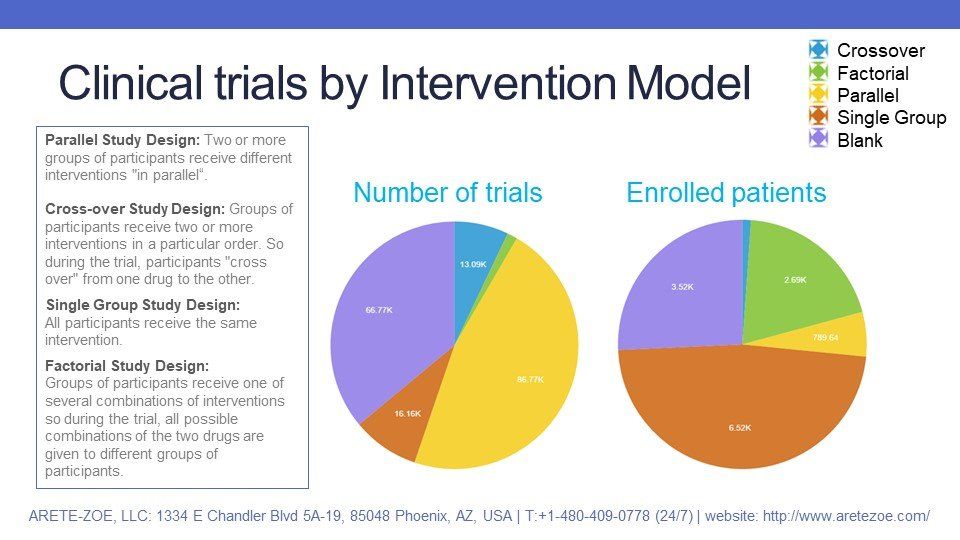
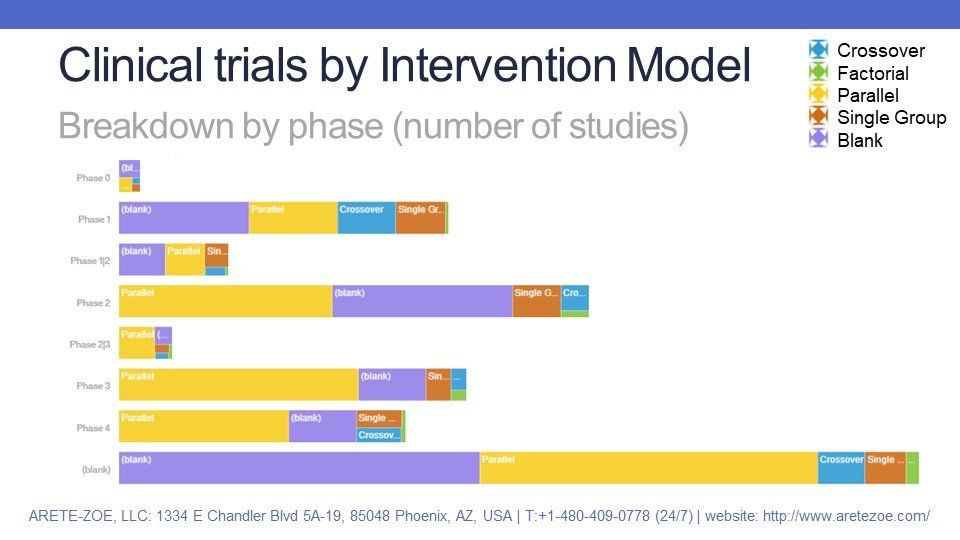
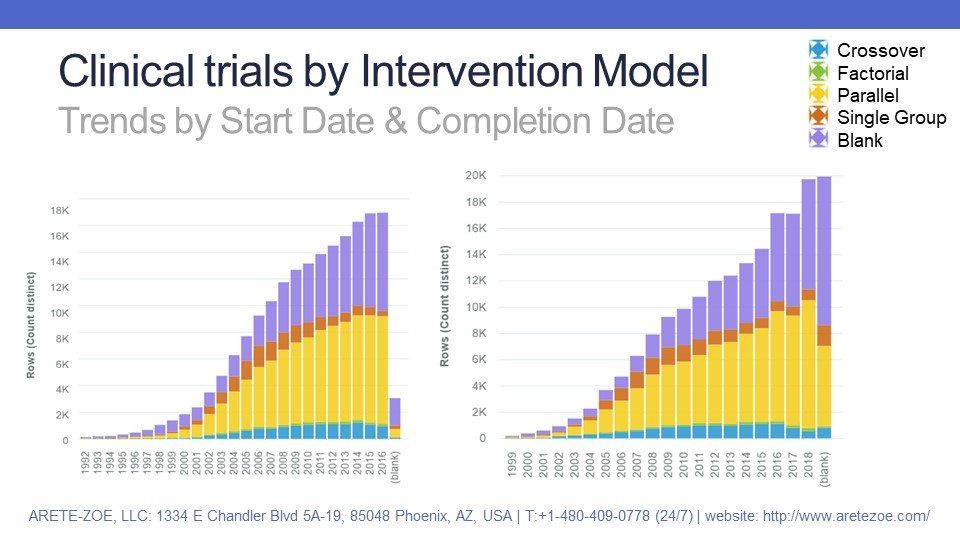
Finally, the intervention model describes the design of the strategy for assigning interventions to participants in a clinical study.
- Parallel Study Design means that two or more groups of participants receive different interventions "in parallel“.
- In a Cross-Over Study design, groups of participants receive two or more interventions in a particular order, so the participants "cross over" from one drug to the other.
- Single Group Study Design means that all participants receive the same intervention.
- In Factorial Study Design, groups of participants receive one of several combinations of interventions so, during the trial, all possible combinations of the two drugs are given to different groups of participants.
Randomized Cotrolled Trials, the gold standard
In Randomized Controlled Trials, direct comparison is made between two or more treatments groups. Randomization eliminates baseline differences in risk between treatment and control groups. Randomization should make all groups similar in terms of the distribution of risk factors whether these risks are known or unknown. The larger the groups, the greater the probability of equal baseline risks. However, participants in randomized controlled trials are often not representative of the target population, which introduces selection bias and generalizability.
Data available in the ClinicalTrial.gov registry cannot satisfactorily answer the poignant question of quality of evidence studies generate. It would make life of health professionals and researchers much easier, if study results and level of evidence became standard part of all trial reports.

Nařízení (EU) 2017/745 o zdravotnických prostředcích vstoupilo v platnost 26. května 2021. Platnost certifikátů vydaných podle stávajících směrnic vyprší nejpozději 24. května. Toto je třeba provést ve lhůtě, která odpovídá době nezbytné pro přezkoumání dokumentace a před vypršením platnosti současných certifikací. Česká republika stále nemá svůj oznámený subjekt. Jakmile dojde k akreditaci, bude ITC zavalen ohromným počtem nevyřízených podání v českém jazyce. Zajisdtěte si pomoc s podáním od týmu Arete-Zoe, který má s přípravou klinické dokumentace dle MDR bohaté zkušenosti.

The reduction of Czech-based Notified Bodies (NBs) leaves only one still pending accreditation and one in Slovakia that does accept submissions in Czech. The delay in accreditation has produced a significant backlog for submissions pending review and acceptance. The complexity of MDR is more stringent both for the preparers and the reviewers at the NB. This situation introduces many vulnerabilities into the submission process and represents substantial risk that can and should be minimized! The potential consequences of certification delays may be critical for some manufacturers. Is the cost penalty from delay because of necessary revision or rejection worth the minor economy of an in-house effort? Get your staff an assessment from a team with proven MDR success! Contact Arete-Zoe for a courtesy review of your situation and secure assistance that will reduce your risk! Stay agile, competitive, and profitable! What is the current situation? Regulation (EU) 2017/745 on medical devices (the Medical Device Regulation, MDR), which was adopted in April 2017, became applicable in the European Union on 26 May 2021, after a year delay due to Covid [i] . The certificates issued under the existing Directives for medical devices ( 93/42/EEC and 90/385/EEC ) will expire on or before May 24th, 2024. By then, all manufacturers who wish to keep their products on the market as medical devices, will have to upgrade their documents to the new standards. Previous documentation standards fall far short to the new requirements, placing significant burden on both the manufacturers and reviewers at the NB. Many previous submissions under MDR have been rejected based on documentation shortfalls within any of the many sections. When considered with the significant backlog, any aspect of documentation that requires revision only compounds certification delay and may jeopardize market access for many medical devices. All this needs to be done within a period that accounts for the time necessary for review prior to expiration of current certifications. Additionally, there is a significant bottleneck in submission processing due to the limited capacity of NBs in the EU due to a reduction in the number of designated NBs, increased number of products that are subject to review by NB due to reclassification, and increased complexity of MDR submissions compared to MDD/AIMD. The Czech Republic still does not have its own designated NB. Once accreditation occurs, the backlog of Czech language submissions will be overwhelming. The high number of returns and requests for amendments and revisions shall be expected in the initial months, slowing the process further for all. By May 2024, many manufacturers will find themselves in a situation when their products will no longer be marketable in the EU due to expired certificates and face additional consequences from having products purged from supply chain. Discussion MDR is here to stay. Czech Minister of Health MUDr. Vlastimil Válek in his introductory statement at the October 2022 AVDZP Conference [ii] stated that another postponement of MDR is out of question. While it is not in the interest of the European Union to be dominated by non-EU manufacturers, primarily from Asia, it is unlikely that the existing Regulation will be substantially changed to accommodate manufacturers’ concerns. Válek also reminded the public that the Wild East mentality with improvised devices throughout the hospital system that dominated the Czech market in the 1990s is gone and will not return. In short, MDR is a reality to which manufacturers will have to adjust. Notified bodies available to Czech manufacturers under MDR The number of EU NBs that are designated under MDR has increased to 34, half of which are located in Italy (9) and Germany (8). The remaining 17 are in Belgium (1), Croatia (1), Finland (2), France (1), Hungary (1), Ireland (1), the Netherlands (3), Norway (1), Poland (2), Slovakia (1), Slovenia (1), Spain (1) and Sweden (1) [iii] . European manufacturers can pursue certification of their products with any EU NB, with limitations to the type of product and the capacity and willingness of NBs to take on new clients. However, for access to the greatest number of NBs, the submission should be in English. Two Czech NBs were designated in Czechia under the 93/42/EEC (MDD): Institut pro testování a certifikaci, a.s. (ITC) and Elektrotechnický Zkušební Ústav, s.p. (EZÚ). Only one of them, ITC, is in the process for designation under MDR. However, the final scope of MDR codes ITC will be able to process has not been released. One additional institution, Czech Metrological Institute (CMI) is pursuing designation under MDR without prior history in medical devices under MDD or AIMD. The anticipated accreditation will take an additional year. Institut pro testování a certifikaci, a.s. (ITC), Czech Republic ITC’s current designations include Regulation (EU) 2016/425 Personal protective equipment, 2014/68/EU Pressure equipment, 2009/48/EC Safety of toys, Regulation (EU) No 305/2011 - Construction products and 2014/30/EU Electromagnetic compatibility. Designations under 93/42/EEC Medical devices and 98/79/EC In vitro diagnostic medical devices expired in May 2021 (MDD) and May 2022 (IVDD) [iv] . ITC will continue to perform audits under MDD during the transitional period until May 24, 2024. ITC submitted their application for designation under MDR on December 30, 2019. The Designating authority (ÚNMZ) verified completeness of the application and forwarded it to the European Commission in November 2020. The Commission designated the Joint Assessment Team in December 2020, which completed the evaluated in March 2021. On-site Joint Assessment was completed in June 2021. The official JAT report was issued in September 2021. ITC implemented CAPAs in fall 2021. In June 2022, designating authority ÚNMZ completed their review of CAPAs implemented by ITC and submitted it to the Joint Assessment Team for approval. In August 2022, ÚNMZ issued the final report. In September 2022, JAT issued its final assessment and a in October 23022, ITC underwent MDCG review and is now awaiting MDCG opinion that the notification can be accepted. The expectation is that ITC should be listed in the NANDO database by January 2023 for MDR [v] . According to Mgr. Jiří Heš, ITC will primarily serve Czech manufacturers who already are their clients and have certificates issued by them under MDD. New certificates under MDR won’t be issued in time and there will inevitably be a gap in coverage of products with valid MDD certification. [vi] ITC only began preparing application for designation under IVDR. Due to the extensive backlog of MDR certificates, it is reasonable to expect that the process of designation under IVDR will not be any faster. ITC currently does not offer any training on MDR for manufacturers or guidance on how to prepare submissions. The most significant thing any manufacturer can do for themselves is to ensure their submission is as appropriate as possible the first time. But they are left to their own means to sort out the transition from MDD to MDR. Without specific guidance from ITC on their expectations, there is significant risk from the ambiguity of the MDR Regulation itself. However, this risk can be reduced from experience from submissions under MDR to other NBs which will provide reasonable opportunity for a successful submission. Elektrotechnický Zkušební Ústav, s.p. (EZÚ), Czech Republic EZÚ’s current designations include Regulation (EU) No 305/2011 - Construction products and 2014/30/EU Electromagnetic compatibility. EZÚ won’t pursue designation under MDR. The activities EZÚ will continue include audit under MDD during the transitional period for 42 manufacturers whose certificates they serve, certification of quality management systems, and electrical safety. EZÚ also provides training on MDR for manufacturers and distributors [vii] . Czech Metrological Institute (CMI), Czech Republic CMI submitted their initial application in December 2020, a year later than ITC. The Joint Assessment Team evaluation (Article 39, paragraph 4 MDR) was completed in December 2021. In May 2022, CMI submitted their proposed CAPA plan. CMI strives to maintain the scope of devices included in their application (23 out of 44 basic codes and 18 out of 27 horizontal codes). The key requirement is to prove personnel availability for each code. CMI primarily intends to serve Czech manufacturers in Czech language, as only about a third of their reviewers have sufficient proficiency in English. CMI does not provide any training or guidance for manufacturers how to prepare documentation to pass their scrutiny. Certification of products on the Czech market There are over 400 Czech manufacturers listed in the database RZPRO holding nearly 6000 certificates that are currently valid. Of these, 4323 did not previously require the involvement of a NB (Class I). However, due to reclassification, some of these will require involvement of the NB under MDR, further stressing the throughput of the NB. Of the 1634 remaining certificates, 514 were issued by EZÚ and 391 by ITC. Another 133 MDD certificates were issued by other NBs that do not currently have MDR designation. The database also holds 2305 products other than Class I that do not have a NB listed. In total, ITC issued 541 certificates that are currently valid, including manufacturers from other countries. The database currently holds 630 valid certificates issued by EZÚ. All products certified by EZÚ will have to be recertified by another NB [viii] . The list of MDR codes that will be covered by ITC (or CMI, once designated) is not currently available. Mgr. Irena Storova (Czech State Institute for Drug Control) emphasized the quality of the MDR documentation as an essential condition required to avert a crisis. The current speed of issuing certificates by EU NBs is about 1.000 certificates a year. However, the anticipated need for medical devices in Europe is about 23.000 certificates issued by NBs over the period of 20 months, making the transition to MDR extremely challenging. The key problems are insufficient capacity of NB, partly due to accumulated backlog, partly due to increased complexity of MDR compared to MDD/AIMD, as well as inadequate preparedness of manufacturers to meet the new complex requirements of MDR [ix] . Experience of other EU NB shows exponential growth of applications and a serious lag in processing certificates. In February 2021, NBs received 1840 applications and processed 224 certificates. By October 2022, the number of applications grew to 8120, while the number of issued certificates was 1990 [x] . These numbers suggest further accumulation of backlog of unprocessed applications rather than catching up with the growing demand. The time to reach a Certificate according to MDR (MDR Quality Management System and Product certification) typically ranges from 13 to 18 months [xi] . This is consistent with ITC’s estimate that the review of a complete submission will take a year to issue a certificate. This means that all manufacturers who need their certificates renewed before the May 2024 deadline when they all expire will have to submit their applications before May 2023. Since ITC will only start accepting applications after the official MDR designation, it is safe to assume that all applications will be submitted in the period between the designation date and May 2023, creating a long backlog queue. To complicate the situation even further, manufacturers, whose MDR codes won’t be on ITC’s list, will have to look for a different NB to pursue their certificates. Czechia as a low price-point market The low-price level of devices on the Czech market complicates the transition to MDR even further. The system of defining reimbursements for medical devices is very rigid, and there are multiple pressures that keep prices down. These price controls conflict with increased costs associated with certification and recertification of products when considered with increased costs of energy, raw materials, transport, and labor. MUDr. Vlastimil Válek at the AVDZP Conference on October 13, 2022, stated that it is not in the interest of the European Union to allow non-EU manufacturers to dominate the EU market, and that there is an intrinsic value in self-sufficiency in times of crisis [xii] . The results from Survey on certifications and applications performed by MDCG & Stakeholders among NBs (51 NBs asked, 47 replies received) suggest that 60% of medical device clients are non-EU (10,913), compared to 7,143 EU clients [xiii] . Priority treatment for small business is not likely since SMEs are the majority of NB clients, both EU-wide and locally in the Czech Republic. In fact, as the threat for shortage of medical equipment becomes more urgent, policymakers might solve the crisis by prioritizing producers with high capacity, capable of meeting the demands of their respective health systems, as we have seen with the imports of medical equipment and protective materials during the Covid crisis. What is the risk to business due to delays in certification? The ability of NBs to process applications in a timely manner is an essential condition for the function of the medical device sector. This is directly influenced by the quality of manufacturers’ submission for certification. Manufacturers cannot legally keep their products on the EU market without valid certification. And, additional expenses will be incurred, if products have to be recovered from distribution chains due to delays in certification. Furthermore, this will create gaps in coverage, creating a void that can be filled by competitors. Extended periods of absence can stall otherwise good products and limit marketability once certification is finally obtained. Failure to obtain MDR certification for any portion of a product portfolio is an existential threat to any enterprise, potentially forcing reduction of staff, downsizing, making the enterprise vulnerable to competitors, or simply losing viability and going out of business. The absence of a feedback loop regarding the minutia of submissions’ content and format will cause additional delays and adjustments by the industry. ITC does not provide any MDR training and did not issue any guidance documents to facilitate successful submissions and reduce ambiguity relating to the novelty of the process. The first MDR certificate was issued in September 2019 by BSI [xiv] . This means that the cumulative experience in the industry among competition is significantly higher, placing Czech manufacturers 4 years behind other EU players. At present, Czech manufacturers have to rely on training provided by other NBs, industry consultants who rely on the same, in addition to feedback from their clients, and their own understanding of the Regulation and associated MDCG guidelines. Although CzechInvest does have a plan to start a comprehensive training program for manufacturers to facilitate the transition to MDR, the course has not started yet. The first students are expected to graduate in June 2024 [xv] . Learning curve by both newly designated NBs as well as manufacturers will inevitably affect the speed of processing, forcing reworks and amendments that would otherwise be avoidable. Securing consultancy with demonstrated MDR competency will remove substantial risk from the current situation. Recommendations What is the risk, and how does Arete-Zoe help your enterprise to mitigate such risk? The key to a successful MDR certification is a high quality, timely submission that complies with or better, exceeds minimum MDR requirements, ensuring timely processing and avoiding returns, requests for more information and outright rejections. It is important to note that the review and approval process depends on the understanding and application of MDR requirements by individual reviewers. Therefore, exceeding minimum requirements becomes a necessity for confident approval. The impact of additional information requests, although minor in terms of extra work, can be significant due to delays. Additionally, other manufacturers’ failed submissions in a long backlog of applications will continue to burden the system. The quality of the initial submission is essential to avoiding consequences in the transition to MDR and may be the single factor that keeps the business open. Manufacturers who have a fully trained in-house team already should still expect challenges in preparing MDR submissions themselves. The time to develop MDR expertise is very limited, considering the pressure to prepare the full documentation and submit it before May 2023. Even with a well-staffed team, the task can simply be overwhelming due to the sheer volume of material required in contrast to previous MDD/AIMD submissions. Arete-Zoe team has significant experience preparing clinical documentation for clients transitioning from MDD to MDR in both Czech and English and submissions through multiple NBs. Our exceptional success record with clinical documentation includes products that were previously rejected but passed with our assistance. We can help control the risk of failure or delay for our clients by providing the essential support you need to avert a avoidable delays in product certification. Arete-Zoe team can either prepare the full submission or augment your existing team with essential skillset your team might not have. References [i] https://www.ema.europa.eu/en/news/medical-device-regulation-comes-application [ii] Válek, V (2022). Introduction. AVDZP Conference 13/10/2022, Praha, Czech Republic. [iii] NANDO database https://ec.europa.eu/growth/tools-databases/nando/index.cfm?fuseaction=directive.notifiedbody&dir_id=34 [iv] NANDO database https://ec.europa.eu/growth/tools-databases/nando/index.cfm?fuseaction=directive.notifiedbody&dir_id=34 [v] Heš, J (2022). Implementace MDR: Kde jsme a kam směřujeme. AVDZP Conference 13/10/2022, Praha, Czech Republic. Institut pro Testování a Certifikaci. [vi] Heš, J (2022). Implementace MDR: Kde jsme a kam směřujeme. AVDZP Conference 13/10/2022, Praha, Czech Republic. Institut pro Testování a Certifikaci. [vii] Vlasák, M (2022). Dozorová činnost dle MDD. AVDZP Conference 13/10/2022, Praha, Czech Republic. Elektrotechnický zkušební ústav. [viii] Czech database of medical devices RZPRO https://eregpublicsecure.ksrzis.cz/Registr/RZPRO/ZdravotnickyProstredek [ix] Storova, I (2022). Problematika ukončení přechodného období MDR z pohledu SÚKL. AVDZP Conference 13/10/2022, Praha, Czech Republic. State Institute for Drug Control. [x] MDCG & Stakeholders (2022). Notified Bodies Survey on certyifications and applications (MDR/IVDR). 24/10/2022. European Commission. [xi] MDCG & Stakeholders (2022). Notified Bodies Survey on certyifications and applications (MDR/IVDR). 24/10/2022. European Commission. [xii] Válek, V (2022). Introduction. AVDZP Conference 13/10/2022, Praha, Czech Republic. [xiii] MDCG & Stakeholders (2022). Notified Bodies Survey on certifications and applications (MDR/IVDR). 24/10/2022. European Commission. https://health.ec.europa.eu/latest-updates/notified-bodies-survey-certifications-and-applications-2022-10-26_en?fbclid=IwAR3w3YH7UD2HBccQ6pBKWP3UlpgSnvQj9qFoNUeLIF-6ZWl8IOwP2Wx88Tk [xiv] BSI (2019). BSI certifies first product to the Medical Devices Regulation. 02 September 2019. BSI. https://www.bsigroup.com/en-GB/medical-devices/news-centre/enews/2019-news/bsi-certifies-first-product-to-the-medical-devices-regulation/ [xv] Hájek, J (2022). Národní plán obnovy. Komponenta 1. 4. Digitální ekonomika a společnost, inovativní start-upy a nové technologie. Program na podporu specifických systémových a produktových certifikací a souvisejícího vzdělávání. AVDZP Conference 13/10/2022, Praha, Czech Republic.

More than 500,000 medical technologies are available on the European market, from hospitals to community care settings and people's homes. The products range from syringes, pregnancy tests, and wheelchairs to X-Ray machines and body scanners, pacemakers, hip implants, and pharmacogenomic tests. The medical technology industry is the source of a constant flow of innovations. The sector spends about 8% of its sales on R&D. Typical product lifecycle is about 18 to 24 months when a new, improved version becomes available. In 2020, the European Patent Office (EPO) accepted nearly 14,200 patent applications in the medical technology sector, trumping pharmaceutical patents (8,500 applications) and biotechnology (7,200). European and U.S. entities filed almost 80% of the applications (38% EU and EEA, 39% U.S.) [ 1 ]. The European medical technology sector employs more than 760,000 people, mainly in Germany (210,000), the United Kingdom (102,800), Italy (94,000), France (89,000), Switzerland (63,000), and Ireland (40,000), accounting for 0.3% of total employment. In comparison, the European pharmaceutical industry employs around 795,000 people. These jobs reach a value-added of about €184,000 per employee. More than 33,000 medical technology exist in Europe, of which 95% qualify as small, medium, and micro-sized companies (SMEs). The majority of these enterprises employ less than 50 people [ 1 ]. In 2020, Europe had a positive trade balance in the medical technology sector of € 8.7 billion. Compared to 2019, the European trade balance dropped by 27.5% (€ 12 billion in 2019). The most important trading partners for Europe are the United States, China, Japan, and Mexico. Germany, Ireland, the Netherlands, Belgium, and Switzerland have the highest trade share, both within and outside the EU [ 2 ]. Until May 2021, the medical device sector was regulated by Medical Device and In Vitro Diagnostic Device Directives 93/42/EC and 90/385/EEC (MDD and IVDD), when the new Regulations replaced these: Medical Device Regulation (EU) 2017/745 (MDR) and In Vitro Diagnostic Device Regulation (IVDR) 2017/746 [ 3 ],[ 4 ]. The new regulations introduced numerous changes, including the reclassification of some devices, requiring additional obligations for manufacturers to comply with. About 85% of in-vitro diagnostic devices will now require Notified Body involvement, compared to ~20% under the IVDD. Existing MDD/IVDD certificates remain valid until May 2024. After this date, all devices on the EU market must comply with the new MDR/IVDR regulations [ 5 ]. For some manufacturers, the costs associated with keeping some of their devices on the market under MDR/IVDR may no longer justify the expense considering their profitability. Others may not be able to obtain new CE Mark certification in time due to decreased capacity of notified bodies. These factors combined are already reducing the number of devices on the EU market and limiting the certification of innovative products. The number of notified bodies available to review new certifications and recertifications dropped significantly under the MDR/IVDR. Of 51 notified bodies designated to MDD [ 6 ] and ten to AIMDD [ 7 ], only 29 obtained designation for MDR, of which seven operate in Germany, seven in Italy, and three in the Netherlands [ 8 ].

The Medical Device industry produces a vast number of products, ranging from bandages and surgical instruments to life function monitors to imaging technology. The technology currently in use varies from devices that have been in use for decades to highly innovative products. Innovations in the medical device field are frequent and typically incremental in response to feedback from physicians. Mordor Intelligence estimated the global Medical Devices market at USD 532.62 billion in 2021, growing at a CAGR of around 5.5%, to reach USD 734.39 billion in 2027 [1]. Fortune Business Insights projects the global medical devices market growth from $455.34 billion in 2021 to $657.98 billion in 2028 at a CAGR of 5.4%. This development follows a decline from 2020, when CAGR dropped to 3.7% due to the pandemic [2]. The key drivers of market growth include the rising prevalence of chronic diseases, increased disability throughout the population, technological advancements in medical devices, and population aging. The U.S. medical device market was valued at USD 186.5 billion in 2021 and is anticipated to exhibit a compound annual growth rate (CAGR) of 5.0% over the forecast period to reach USD 262.4 billion in 2028 [4]. The Medical Device sector is even larger than Biopharmaceuticals, that by comparison, employed over 224,000 people, earning $21.2 billion [3]. The rising prevalence of chronic diseases and the increasing geriatric population in the country are the key market drivers. The Medical Device industry has a significant impact on the U.S. economy and supports hundreds of thousands of jobs. More than 80 percent of U.S. medical device companies have fewer than 100 employees [5]. In 2020, the U.S. Medical Device industry supported over 329,000 jobs, with an annual payroll of $25.8 billion [3]. Employment and payroll for Medical Device Subsectors, 2020 ( SelectUSA ):

In the high consequence environment of pharmaceutical development, any assumption made earlier in the process can prove extremely costly if uncorrected once more information becomes available. From a business perspective, it is essential to create a safe avenue for communication of concerns regarding the drug candidate’s efficacy, safety, toxicity, or pharmacological function immediately as the researchers become aware of them.

Innovation always involves the risk of failure. It is an art to see what the data show, and what they don't, and which projections are the result of our wishful thinking or unsubstantiated assumptions. It may be just my impression that 14th-century logician William of Ockham whispers in my ear that entities shall not be multiplied unnecessarily.

Companies are growing in size due to acquisitions and mergers. Operations routinely span across geographical, jurisdictional, and cultural boundaries. The trend of industry consolidation continues in 2015 and 2016: the total number of deals flattened and remained even at around 600 mergers a year. Geographically, mergers, and acquisitions have been shifting from the U.S. to Western Europe. This shift is the result of transactions driven by the need to add complementary products to the core business areas and tax inversions.


